Platform · Tracking and reporting
Influencer tracking, with every number sourced
Our team and our AI agents find each creator’s live post, check it against the brief and add it to your campaign’s report. Each post’s numbers are read three times a day, from the public post.
- Views, likes, comments, shares and saves for every post
- The creator connects nothing and installs nothing
- One figure for cost: the creator cost per 1,000 views
- 11.4M
- views tracked on paid creator posts
- 3 times a day
- each post’s numbers are read
- $9.92
- creator cost per 1,000 views on the campaign shown below
On Instagram and TikTok.
From the public post. The creator connects nothing.
Creator fees only. Ad spend is not in it.
The report
Every post of a campaign in one report
This chart is the running view count of one real campaign for Syncron. The whole report, post by post, is lower on this page.
- 4.9M views on this one campaign’s posts
- Read from the public posts three times a day
- A view count includes views from ads run on the post
From a real campaign’s report. This one is not a test record.
Found for you
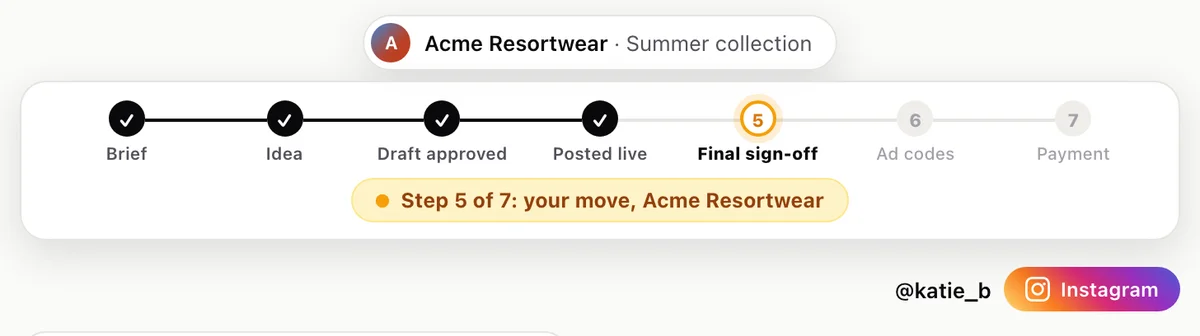
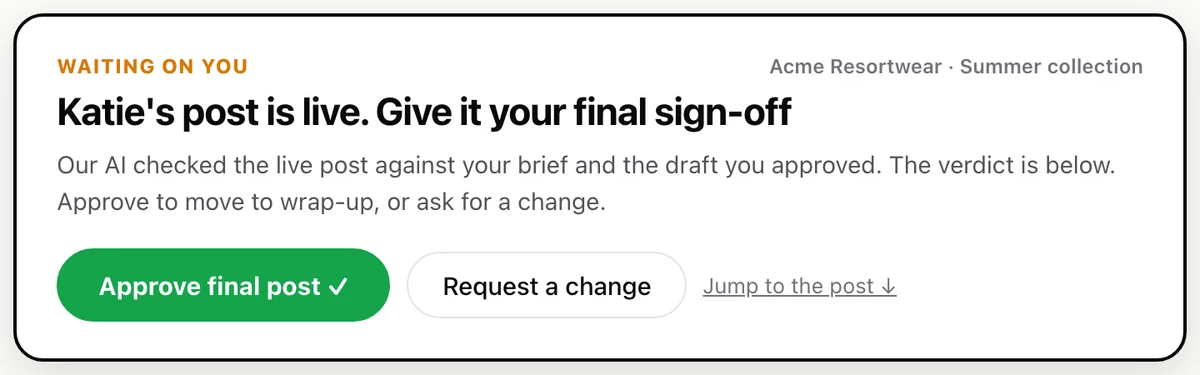
We find the live post, and you sign it off
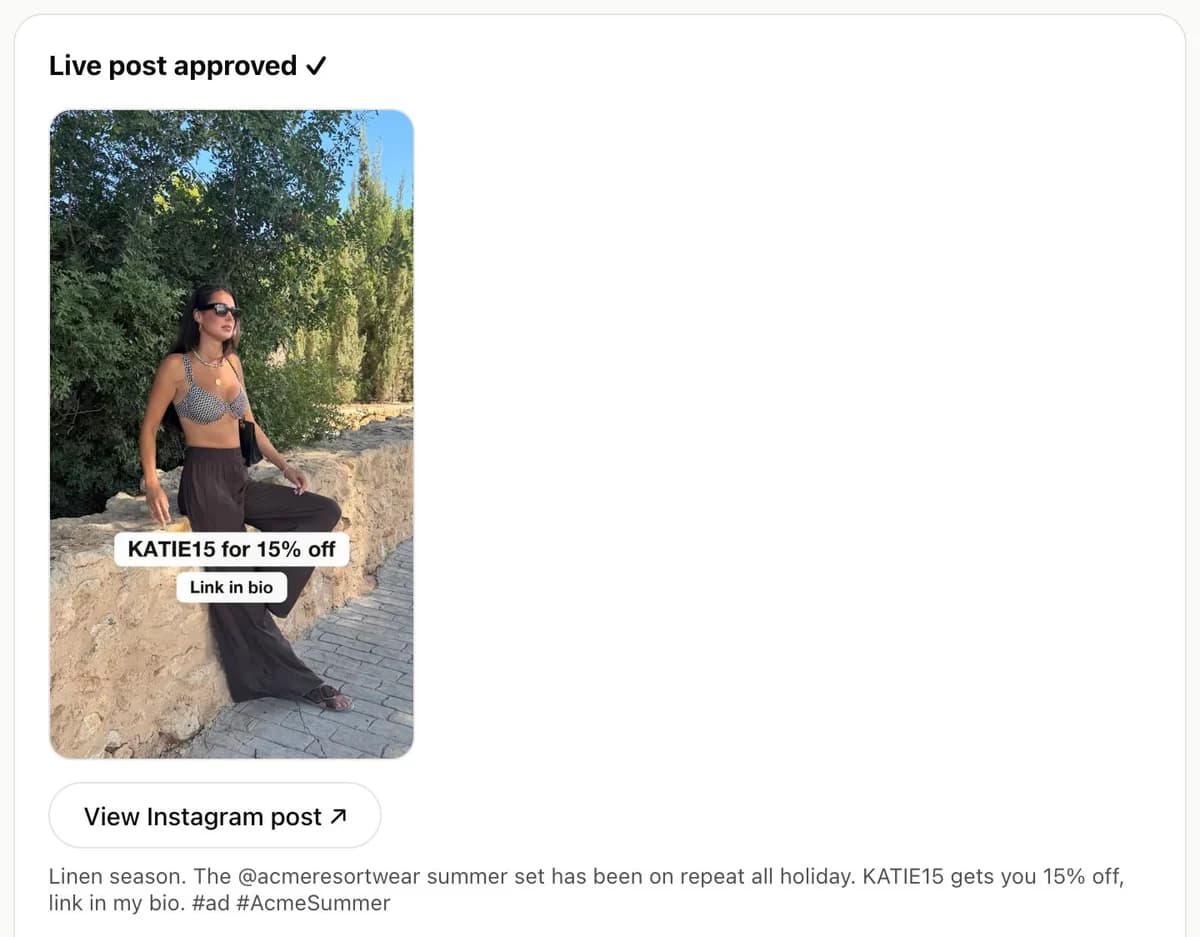
Our tool looks for each creator’s live post four times a day. When it finds one, we compare it with the brief and with the draft you approved. Then you give the final sign-off.
- No link to send us and no screenshot to chase
- The caption and the paid partnership label are checked
- You can ask for a change before you sign off
Numbers you can explain
Each number says where it came from
A public count, a creator’s own screenshot and an estimate are three different things. The report keeps them apart, and it says what a view count includes.
- Views, likes and comments are the public counts on the post
- Reach and story views come from the creator’s own insights
- Sales are counted only where a link or a code can count them
- 4.9M
- views, read from the public posts
- 34,866
- likes, comments, shares and saves
- $9.92
- creator cost per 1,000 views, without ad spend
The same real campaign: Syncron, June 2026 influencer campaign.
How it works
How a post gets into the report
- 01
The creator posts
On the dates in their agreement.
- 02
We find the post
Our AI agents look four times a day.
- 03
You sign it off
After we compare it with the draft you approved.
- 04
It joins the report
Its numbers are read three times a day.
The difference
Tracking a campaign on your own, or through Sup
Finding the posts
On your own
You check each creator’s profile
With Sup
Found for you, four times a day
The numbers
On your own
Screenshots sent by each creator
With Sup
Read from the public post, three times a day
The report
On your own
A spreadsheet you update by hand
With Sup
One report for the campaign, kept current
Paid views
On your own
Mixed in without a note
With Sup
Stated: a view count includes views from ads run on the post
The detail
A real report, and where each number comes from
Influencer tracking is the record of what each creator posted and what happened to it: the views, the engagement and the cost. Below is one real report with every post in it, then how each number is collected.
A real report
Syncron: June 2026 influencer campaign
Most reporting pages offer a blank template, or ask for your email first. This is a finished campaign, with every post that was tracked. Tap a creator to open the post and check the number yourself.
- 4.9M
- views, on Instagram and TikTok
- 34,866
- likes, comments, shares and saves
- $9.92
- creator cost per 1,000 views
Includes views from ads run on the posts.
Creator fees only. Ad spend is not in it.
A step up is a day when views came in, or a day when posts were added to the report. A post is added after we find and check it, which can be days after it went live. Its count is a running total, so no views are lost.
| Creator | Platform | Posted | Views | Likes | Comments | Shares | Saves |
|---|---|---|---|---|---|---|---|
| @andrewsdayinthelife | 1 Jul | 905,787 | 7,949 | 117 | 438 | 85 | |
| @jamiejoyce2 | 20 Jul | 489,699 | 1,385 | 14 | 9 | 22 | |
| @hortwhale | TikTok | 18 Jul | 397,200 | 672 | 0 | 16 | 24 |
| @andrewsdayinthelife | TikTok | 1 Jul | 303,800 | 1,065 | 12 | 38 | 97 |
| @undftd.anthony | TikTok | 27 Jun | 291,000 | 365 | 3 | 9 | 17 |
| @undftd.anthony | 27 Jun | 272,080 | 1,148 | 17 | 17 | 10 | |
| @lexi31ellis | TikTok | 3 Jul | 271,700 | 197 | 0 | 1 | 9 |
| @jamiehagiya | TikTok | 20 Jul | 232,900 | 67 | 0 | 2 | 5 |
| @karenardilad | TikTok | 9 Jul | 219,500 | 1,232 | 9 | 10 | 133 |
| @gisss.ellle | TikTok | 6 Aug | 198,700 | 241 | 2 | 0 | 8 |
| @bodybyvaleria | TikTok | 14 Jul | 189,400 | 86 | 0 | 0 | 15 |
| @jen_deleon | TikTok | 26 Jun | 183,400 | 122 | 2 | 3 | 6 |
| @gisss.ellle | 6 Aug | 159,223 | 1,230 | 8 | 17 | 6 | |
| @jen_deleon | 27 Jun | 106,321 | 695 | 37 | 7 | 14 | |
| @runningbykari | TikTok | 22 Jul | 88,600 | 52 | 2 | 0 | 0 |
| @fitbylalo | TikTok | 30 Jul | 86,600 | 163 | 4 | 3 | 14 |
| @tzlfitness | 9 Jul | 73,916 | 685 | 14 | 11 | 29 | |
| @eveatthegymm | 30 Jun | 52,306 | 2,528 | 37 | 41 | 137 | |
| @karenardilad | 10 Jul | 35,746 | 0 | 4 | 13 | 93 | |
| @andi.renay | 3 Sept | 35,682 | 997 | 5 | 20 | 17 | |
| @fitbylalo | 30 Jul | 33,206 | 1,485 | 32 | 42 | 17 | |
| @alisssaoddo | 20 Jul | 32,258 | 1,063 | 23 | 67 | 153 | |
| @sophia_hartwell | 18 Jul | 32,244 | 349 | 4 | 20 | 28 | |
| @lexi31ellis | 3 Jul | 28,897 | 519 | 10 | 6 | 29 | |
| @andi.renay | TikTok | 3 Sept | 28,800 | 2,744 | 11 | 12 | 69 |
| @easybran | 25 Jun | 27,385 | 1,078 | 11 | 38 | 99 | |
| @devinedwelling | 25 Jun | 21,919 | 194 | 10 | 3 | 17 | |
| @runningbykari | 16 Jul | 20,843 | 242 | 14 | 3 | 4 | |
| @bodybyvaleria | 14 Jul | 19,092 | 124 | 15 | 3 | 5 | |
| @eveserenaa | TikTok | 1 Jul | 15,600 | 2,080 | 24 | 11 | 68 |
| @alexsiquig | 24 Jun | 13,542 | 134 | 34 | 4 | 3 | |
| @alisssaoddo | TikTok | 22 Jul | 13,300 | 496 | 4 | 2 | 40 |
| @emma_malabuyo | 22 Jul | 13,013 | 211 | 7 | 5 | 3 | |
| @easybran | TikTok | 25 Jun | 8,821 | 326 | 7 | 6 | 28 |
| Open the post | TikTok | 25 Jun | 2,954 | 54 | 2 | 2 | 4 |
| @malaboujee_ | TikTok | 22 Jul | 1,352 | 87 | 4 | 4 | 3 |
| @alexsiquig | TikTok | 24 Jun | 1,084 | 42 | 0 | 4 | 4 |
| @elliotmarkuson | 22 Jul | 1,035 | 48 | 8 | 1 | 1 |
Read on 5 October 2026. Views are the public count on each post and include views from ads run on it. No post shows a cost, because that would give away a creator’s fee.
Where the numbers come from
How each number is collected
A dashboard that calls itself real time tells you nothing about where a number came from. This is every figure in a Sup report, its source and what it cannot tell you.
| Number | Where it comes from | How often | What it misses |
|---|---|---|---|
| Views | The public count on the post | Three times a day | It cannot be split into views from an ad and views from followers |
| Likes and comments | The public counts on the post | Three times a day | A creator can hide the like count on Instagram. The public figure is then not the real one |
| Shares and saves | The public counts, where the platform shows them | Three times a day | Instagram does not always show shares, so this count can be low |
| Reach and story views | The creator’s own insights, sent as screenshots | Once, before the creator is paid | It is one moment in time, reported by the creator |
| Clicks and sales | A link or a promo code, counted in your shop | As your shop reports it | A post’s counts say nothing about sales. Without a link or a code there is no sales figure |
| Creator cost per 1,000 views | Creator fees divided by views, times 1,000 | With every reading of the views | It leaves out ad spend, so it is lower than the CPM in an ad account |
| Earned media value | A formula. It is an estimate, not a count | When you ask for it | It depends on the price you assume for a view. Two tools give two answers |
Read this before you compare
What a view count includes
This is the point most reports leave out, and it changes how you read every total above.
One count, two sources
When a creator’s post is run as an ad, the post keeps one public view count. Views from the ad and views from the creator’s followers are added together. Only the account owner can see them apart.
So we never write "organic"
The views in a Sup report are the public count. On a campaign that used Spark Ads or partnership ads, a large share of them can be paid. We say so wherever we show the number.
And cost per 1,000 views is not CPM
Ours divides creator fees by views. An ad account’s CPM divides ad spend by impressions. To see the whole cost of a view, add the two spends together.
How a post becomes an ad, and what the creator has to hand over, is on the Spark Ads and partnership ads page. The right to run it is a clause in the contract.
Done for you
From a live post to a line in the report
Tracking tools give you a dashboard to fill. Here our team and our AI agents fill it, and check each post before it counts.
- 01
We look for the live post
Four times a day, on the creator’s Instagram and TikTok, once a draft is approved. Nobody has to send us a link.
- Who:
- Our AI agents
- 02
We check it against what you approved
The live post is compared with the brief and with the approved draft. A post that differs is raised with the creator.
- Who:
- Our team and our AI agents
- You:
- Confirm the live post
- 03
It is added to the campaign’s report
From that day its counts are read three times a day and added to the campaign’s totals.
- Who:
- Our team and our AI agents
- 04
The creator sends their own insights
Reach, story views and audience, as screenshots. The contract makes them part of the work, so they arrive before the fee is paid.
- Who:
- The creator
- 05
The cost is set against your target
The report shows the creator cost per 1,000 views and per engagement next to the target you set for the campaign.
- Who:
- The report
- 06
You read it, or send it on
The figures are the ones on this page: every post, its link and its counts. An agency can pass the same report to its client.
- Who:
- You
How we counted. The report is read from Sup’s own campaign reporting, the same source as the figures on our campaign pages. A post that a creator later removed is left out of the table. Read on 5 October 2026.
Counted or estimated
Three numbers people call ROI
Return on investment is profit from the campaign divided by its cost. It needs a sales figure, so it needs a link or a code. Return on ad spend is revenue divided by ad spend only, and leaves creator fees out. Earned media value is what the same views would have cost as ads, at a price you assume. Reports often show one and call it another.
A Sup report keeps counted numbers apart from estimates. Views, likes, comments, shares and saves are counted. Earned media value is an estimate, and you can work it out with the EMV calculator. The CPM calculator ranks creators by cost per 1,000 views.
To measure sales, read how to use promo codes for tracking and how to measure influencer marketing ROI. To check one creator’s account before you book them, use the free influencer analytics tool.

Written by
Matt Greenwell, Co-Founder and CEO of Sup
Matt started Sup in 2024 with Hassan Munir. Before Sup he co-founded Storefront, the marketplace for booking pop-up retail space. Before that he worked at Goldman Sachs.
The report is read from Sup’s own campaign reporting. The posts are public, and no fee is shown. Updated 5 October 2026.
FAQ
Influencer tracking questions
How do you track an influencer campaign?
Record every post, then read its public counts on a schedule: views, likes, comments, shares and saves. Add what only the creator can see, such as reach and story views, from their own insights. Count sales separately, with a link or a promo code, because a post’s counts say nothing about what people bought.
Which metrics should I track?
It depends on the goal. For awareness: views and the creator cost per 1,000 views. For interest: engagement and saves. For sales: clicks and orders from a link or a code. Pick the one that matches the goal before the campaign starts, and report the others as context.
Does a view count include paid views?
Yes, when the post has been run as an ad. A post has one public view count. Views from the ad and views from the creator’s followers are added together, and only the account owner can see them apart. So we report "views", never "organic views".
How often are the numbers updated?
Three times a day for every post in a campaign. The totals on this page were read on the date shown under the report.
Do creators need to sign up or connect their account?
No. The counts are read from the public post. The only thing a creator sends is their own insights for the post, as screenshots, before they are paid.
How do I track sales from a creator’s post?
Give each creator their own link or promo code and count the orders in your shop. A view count cannot tell you who bought. Our guides on promo codes explain how to set them up.
What is a good cost per 1,000 views?
It depends on the audience and the content, so compare a campaign with its own target. The campaign shown on this page cost $9.92 per 1,000 views in creator fees. That figure leaves out ad spend, so it is not the same as the CPM in an ad account.
What should an influencer marketing report include?
The posts, each with its link and its counts. The totals, the cost against the target, and where each number came from. Estimates such as earned media value should be labelled as estimates. A report that hides its sources cannot be checked by the person you send it to.
The rest of the platform
One team does all six
Contracts
The agreement our creators sign, clause by clause, and the terms that are usual in it.
Creator search
A live search of Instagram and TikTok, with one real shortlist and the reasons brands drop creators from it.
Outreach
Where our outreach contacts stand today, why creators say no, and the emails we send.
Payments
How creators are paid, how long it takes on our campaigns and what you pay for.
Briefs and approvals
The approval process step by step, how many versions a draft takes and a checklist to copy.
The campaigns we run
UGC, Spark Ads and partnership ads, gifting, influencer posts, ambassador programs and TikTok.
Tracking more than a few creators?
Sup finds every live post, checks it against what you approved and reads its numbers three times a day. You get one report per campaign, and you only pay for posts that go live.
 Book a call