
You’re probably looking at two creator profiles right now that seem equally good on paper.
Both fit your niche. Both post consistently. Both have a tidy follower count and polished content. One might even have a nicer feed. But if you’ve run enough influencer campaigns, you know the expensive mistake isn’t choosing the creator with the less aesthetic grid. It’s choosing the one whose audience doesn’t respond.
That’s where an instagram engagement calculator becomes useful. Not as a magic tool, and not as a final decision-maker, but as a fast way to check whether a creator’s audience is active or just decorative.
The problem is that too many teams stop there. They calculate a percentage, compare it loosely to a benchmark, and assume they’ve done proper vetting. They haven’t. Engagement is a starting signal. Revenue, bookings, footfall, and attributed conversions are the finish line.
Beyond Likes The True Meaning of Engagement
A follower count tells you how many people chose to click follow. It doesn’t tell you how many still care.
That’s why brands keep running into the same issue. They partner with a creator who looks established, then the post goes live and nothing meaningful happens. A few likes arrive. Some generic comments appear. Sales don’t move. Bookings stay flat.
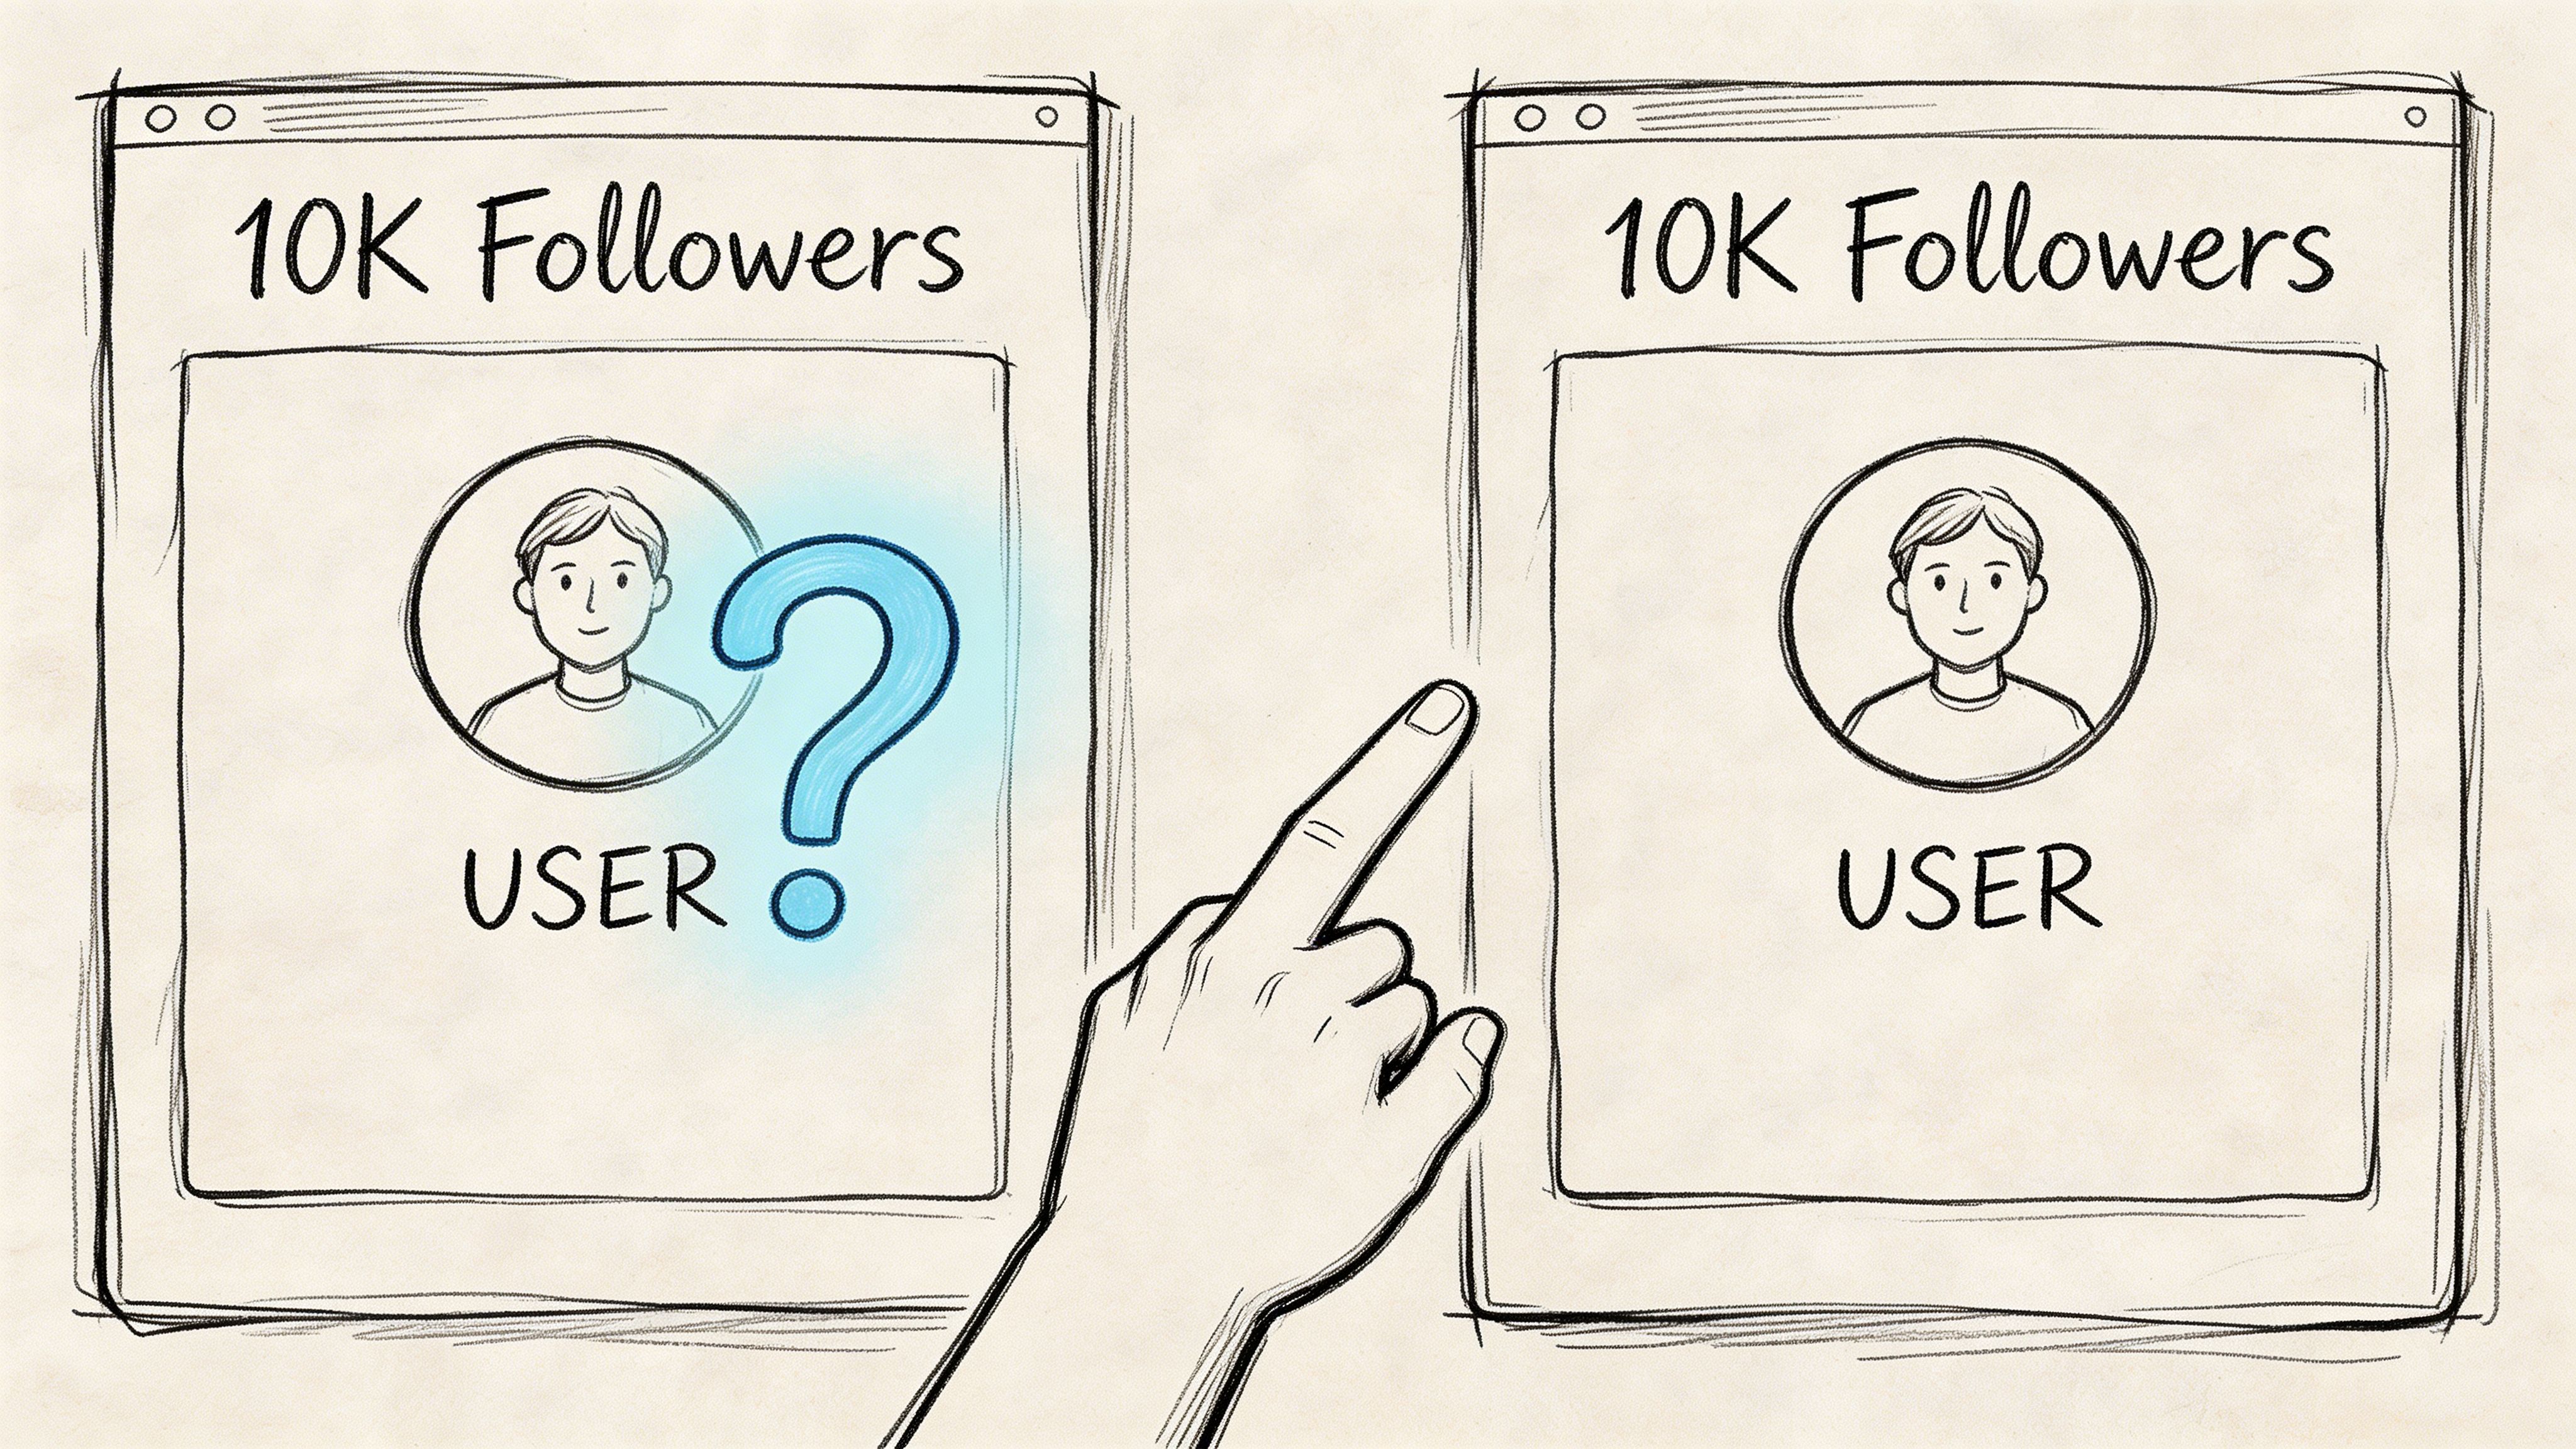
Follower count is a weak filter
Two creators can each have 10,000 followers and perform very differently.
One has an audience that saves posts, asks questions, shares recommendations, and replies when the creator mentions a product. The other has a passive audience that scrolls past almost everything. On a spreadsheet, they look similar. In a campaign, they’re not.
An instagram engagement calculator helps separate those two situations by turning visible audience activity into something you can compare.
What should count as engagement
The useful actions are the ones that suggest attention or intent:
Likes show lightweight interest.
Comments can show stronger attention, if they’re relevant.
Shares suggest a post had enough value to pass on.
Saves often matter more than likes for practical or aspirational content.
Clicks, DMs, and other deeper actions matter when you’re judging business impact, even if many free calculators ignore them.
Engagement is less about applause and more about proof that an audience is awake.
A creator with a smaller but responsive audience is often the better commercial partner than a larger creator with weak interaction. That’s especially true for local hospitality, ecommerce, and niche consumer brands where relevance matters more than broad visibility.
Raw engagement still isn’t the whole story
A high number of likes can still mislead you.
Some creators have inflated engagement from one-off viral posts. Others attract low-quality comments that look active but say very little. Some perform well in entertainment-style content and poorly when asked to drive action.
That’s why a calculator is a health check, not a diagnosis. It tells you whether it’s worth digging deeper.
Decoding the Formulas Behind Engagement Calculators
Most instagram engagement calculator tools aren’t doing anything mysterious. They’re applying one of a few formulas, then presenting the result as a percentage.
The hard part isn’t the maths. It’s choosing the right formula and using it consistently.
Engagement rate by followers
This is the most familiar formula:
Engagement Rate by Followers = Total Engagements ÷ Follower Count × 100
It’s useful when you want a quick read on audience loyalty. If a creator has built a real community, this number can help you spot it.
The practical issue is that not every follower sees every post. So this formula can underrate strong content or flatter weak content, depending on how much reach the post received.
A simple example from HeyTrendy’s explanation of engagement formula variance shows how sensitive the numbers are. A creator with 12,000 followers and 960 average likes has an 8% engagement rate by followers.
That sounds excellent. But it only tells part of the story.
Engagement rate by reach
This formula shifts the denominator:
Engagement Rate by Reach = Total Engagements ÷ Reach × 100
This is often more useful for judging how a specific post performed once people saw it. It answers a cleaner question: of the people reached, how many engaged?
If one Reel reached far beyond the follower base, engagement by reach can tell you whether that broader distribution produced response or just views.
Why formula choice changes your shortlist
Different formulas can produce different rankings for the same creator pool.
A creator can look average under a follower-based formula and strong under a reach-based formula. Another can look great on follower engagement but underperform on content delivery. If your team switches methods halfway through sourcing, you’ll end up comparing unlike with unlike.
Practical rule: Pick one core formula for vetting, document it, and use it across every creator review.
A third variant for video-first campaigns
Video-heavy campaigns add another wrinkle. Some tools use a view-based calculation, especially for Reels:
(Likes + Comments + Shares) ÷ Views × 100
This is useful when your decision depends on how people respond after watching, rather than how large the creator’s total audience looks.
Here’s the operational takeaway:
Use follower-based engagement when comparing creator communities.
Use reach-based engagement when judging individual post performance.
Use view-based engagement when video is the main format and viewing behaviour matters.
A calculator is only as helpful as the method behind it. If the formula doesn’t match the campaign objective, the percentage won’t help much.
Benchmarking Your Creator Engagement Rates in 2026
A percentage on its own is nearly useless.
If a creator has a 1.2% engagement rate, is that poor, average, or strong? The answer depends heavily on creator size. That’s why benchmark context matters more than the calculator output itself.
According to Azarian’s summary of Hootsuite’s 2026 engagement benchmark data, the median Instagram engagement rate across all accounts is 0.98%. The same source notes that micro-influencers with 1,000 to 5,000 followers average 4.8%, while creators with 20,000 to 100,000 followers average around 1.2%.
That gap is often underestimated.
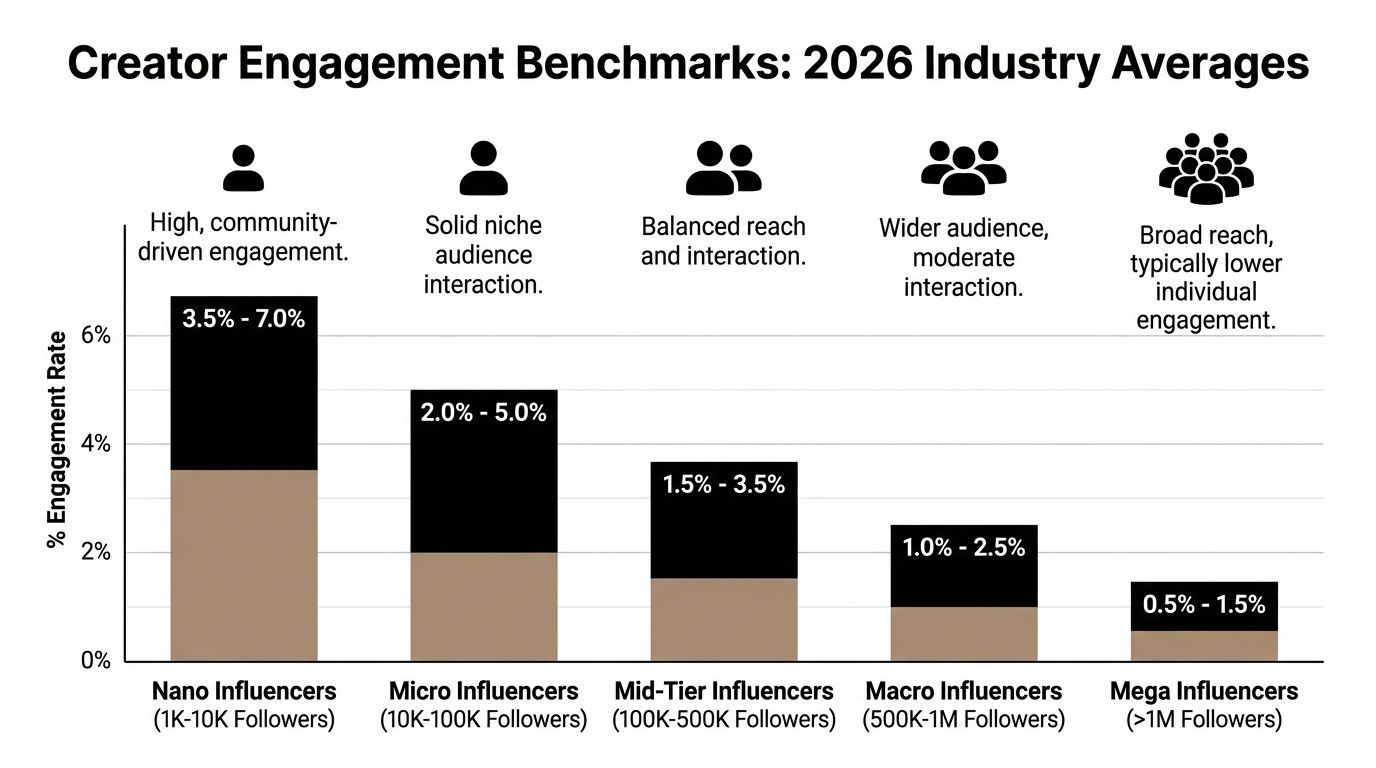
Engagement usually drops as audience size grows
This is normal, not a red flag.
Smaller creators often have tighter audience relationships. Their followers know what to expect, comments are more conversational, and recommendation content feels more personal. As creators scale, audience breadth usually increases faster than audience intimacy.
That doesn’t mean larger creators are ineffective. It means you shouldn’t compare a larger creator’s rate to a nano or micro benchmark and call them weak.
A working benchmark table
Follower Tier | Follower Count | Average Engagement Rate |
|---|---|---|
All accounts median | All account sizes | 0.98% |
Micro influencers | 1,000 to 5,000 followers | 4.8% |
Larger mid-sized creators | 20,000 to 100,000 followers | 1.2% |
The simplest reading is this: the “right” engagement rate depends on who you’re evaluating.
Why public benchmarks still leave gaps
Public benchmark data helps, but it’s still broad.
UK brands often need more specific context than a global median can provide. A local restaurant chain vetting neighbourhood creators has a different decision problem from a national beauty brand evaluating broad lifestyle talent. Generic benchmark ranges can get you close, but they won’t tell you whether a creator consistently drives the right audience action in your market.
That’s where campaign-specific benchmark libraries become more useful than one-off calculators. If you’re comparing public data against category context, Sup’s influencer marketing statistics for 2026 is a solid companion read.
Use benchmarks as guardrails, not verdicts
Benchmarks should narrow your list, not choose your creator for you.
A creator above tier average deserves a closer look. A creator below average might still be the right fit if the audience match is strong and content quality is high. The number tells you where to investigate, not where to sign.
Why High Engagement Can Be Deceiving
High engagement looks reassuring. Sometimes it is. Sometimes it’s the metric that tricks you fastest.
A creator can show a strong percentage and still be a poor commercial fit because the activity behind the number isn’t consistent, authentic, or useful.
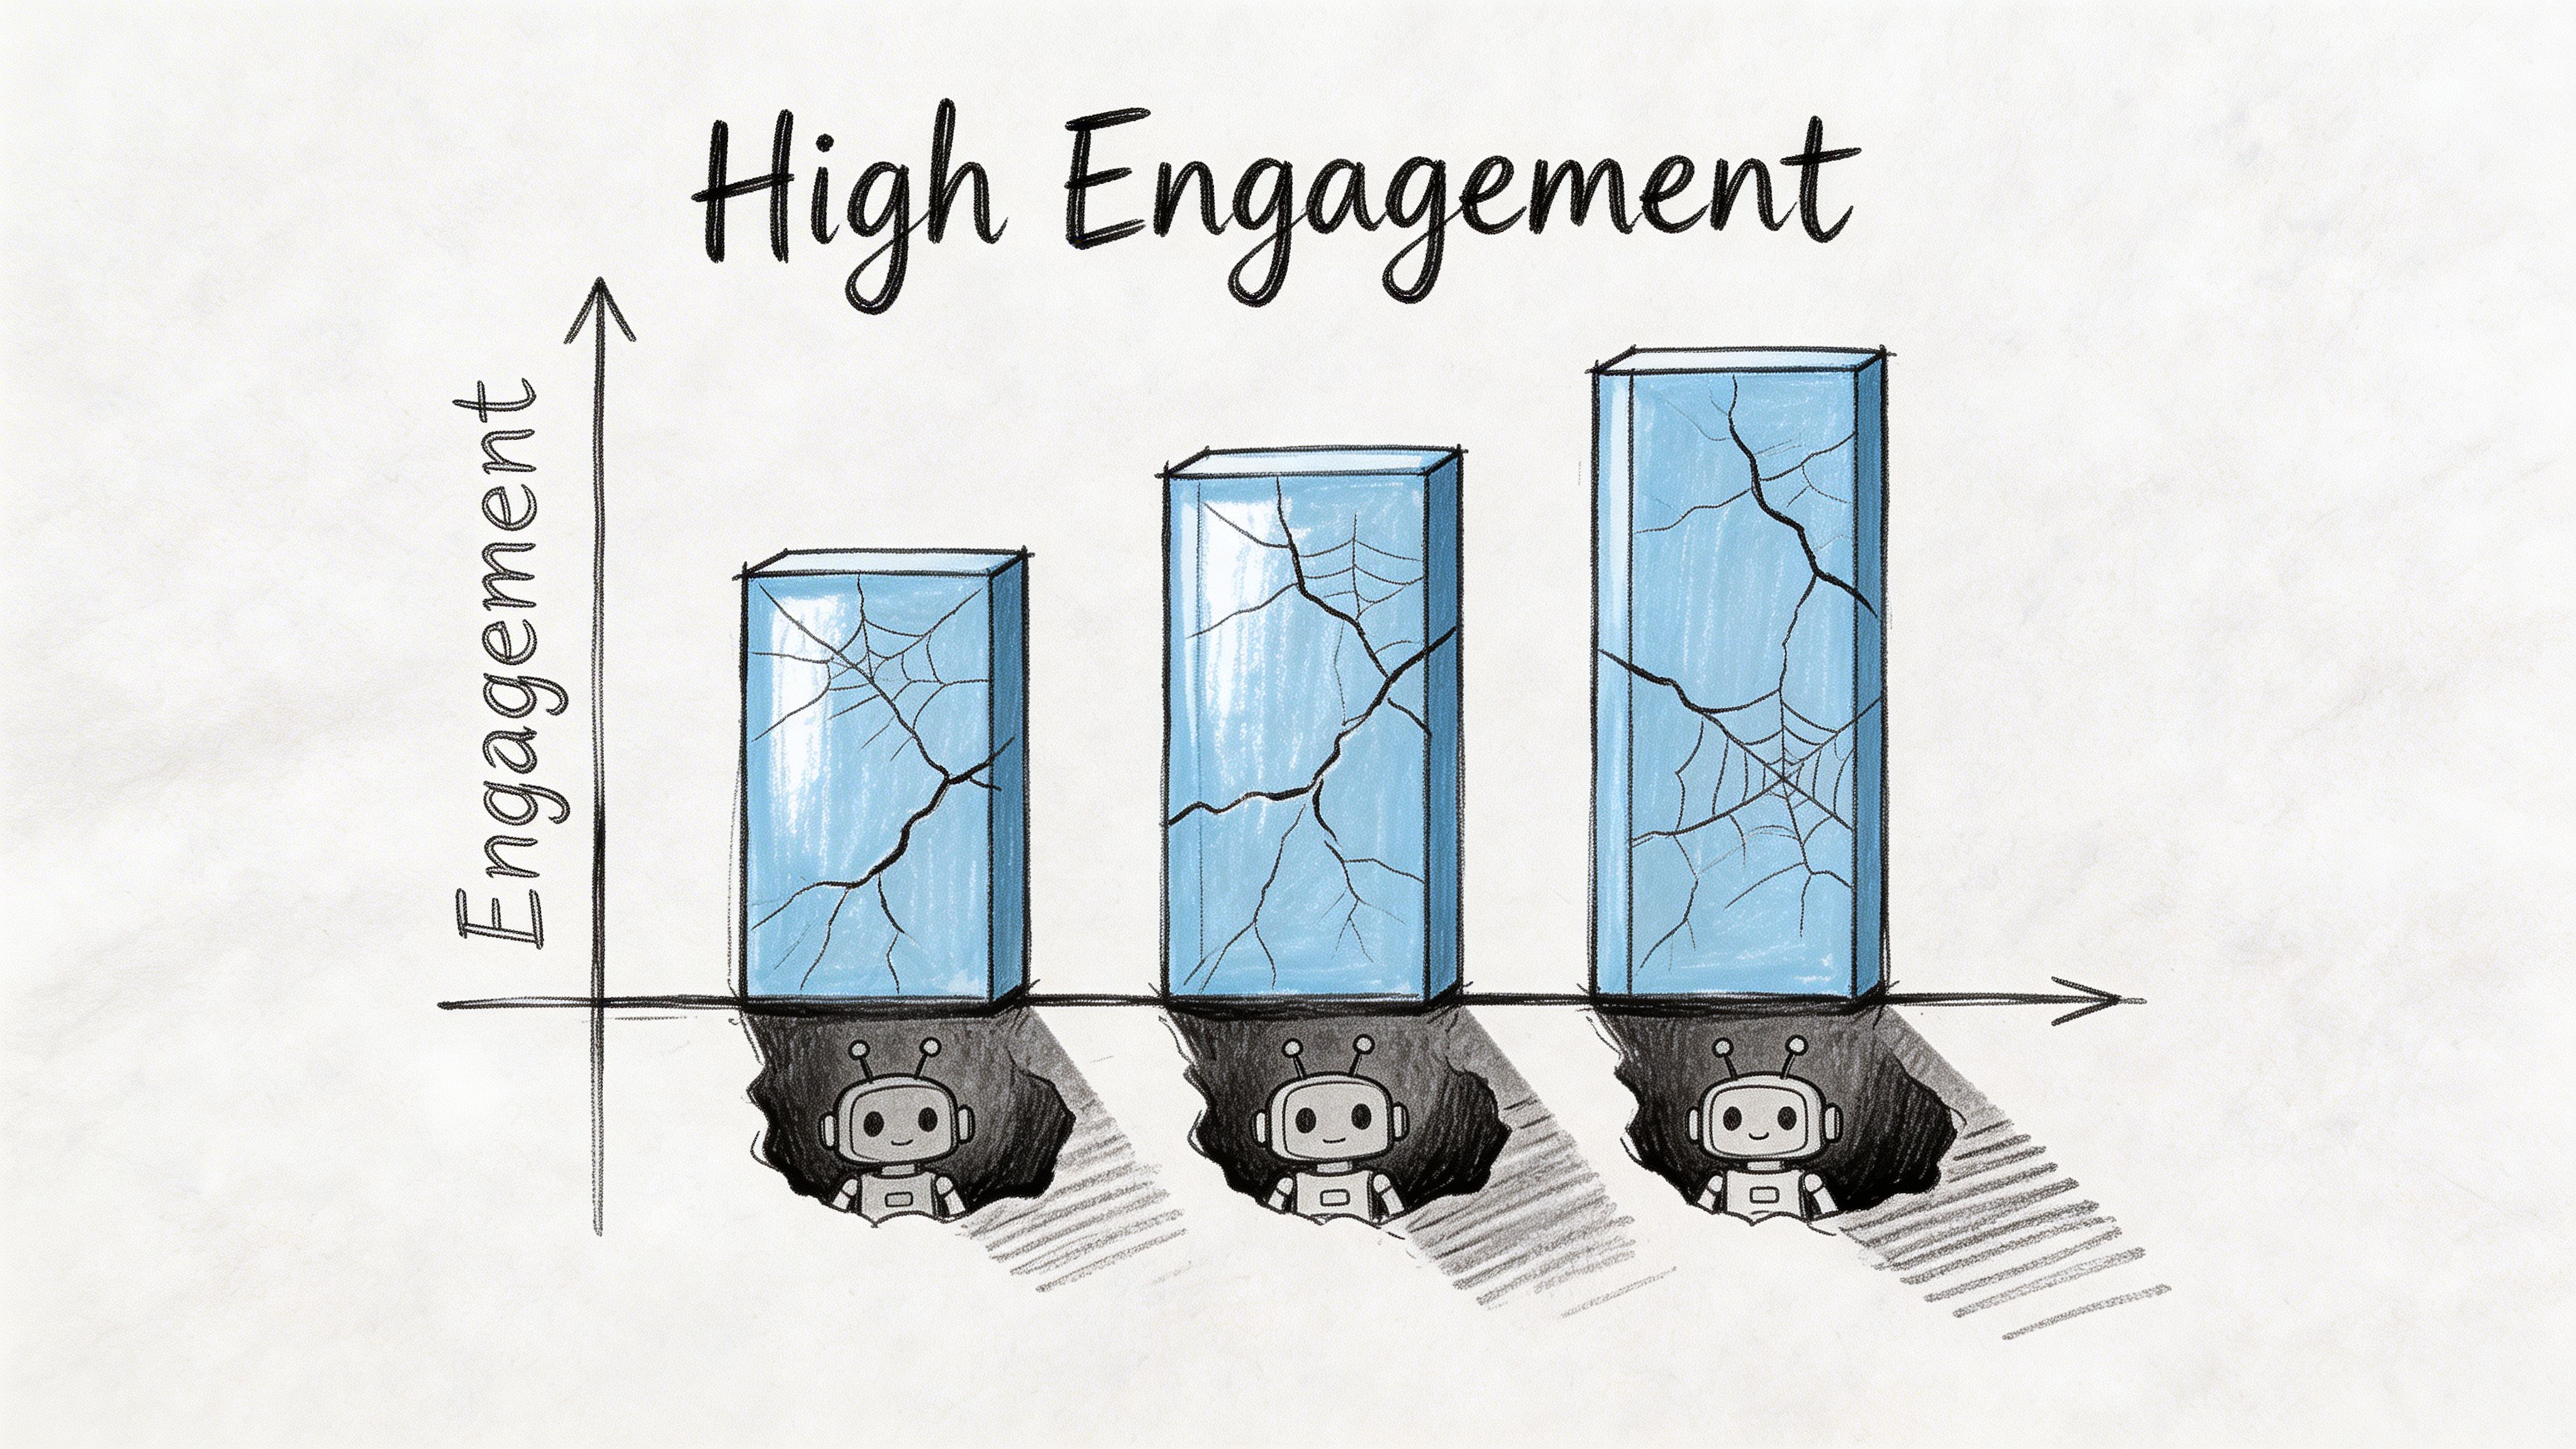
One viral post can distort the whole picture
This is one reason more advanced tools try to smooth the data.
HypeAuditor’s engagement calculator analyses 12 recent posts and excludes abnormally high or low performers so one unusual post doesn’t skew the average. That matters because a single algorithmic spike can make a creator look far more reliable than they are.
If you’re vetting manually, review a run of recent posts instead of grabbing the biggest performer and assuming it’s typical.
Three common traps
Fake engagement: Bought likes and low-quality comments can make a profile look active while delivering no commercial value.
Engagement pods: Groups of creators often comment on each other’s posts in predictable patterns. The activity is real, but the audience signal is weak.
Selective clean-up: Some creators archive or delete underperforming posts, which can make their visible average look stronger than their normal baseline.
Check the comments, not just the count
A useful comment section has variation.
You want specific reactions, relevant questions, product curiosity, and normal audience language. If most comments are repetitive praise, emoji strings, or the same handful of creator accounts appearing every time, be careful.
A creator with fewer comments but better comments is usually the safer bet.
This is also why smaller creators often outperform larger ones in partnership quality. Their communities are easier to inspect and harder to fake at scale. Sup’s write-up on why micro-influencers outperform macro-influencers digs into that trade-off well.
Look for pattern consistency
The strongest creator profiles don’t need one huge post to look good. They show repeatable audience response.
Use this quick audit:
Scan several recent posts rather than one standout.
Check whether engagement is stable across formats.
Read comments for relevance.
Notice who is commenting. Real audience members behave differently from creator circles.
This short breakdown is worth watching if you want a practical visual on inflated engagement signals:
A calculator gives you a signal. A manual review tells you whether that signal is trustworthy.
Using Engagement Data to Vet Influencer Partnerships
Once you stop treating engagement as a vanity metric, it becomes a screening layer inside a larger vetting process.
That process needs to be repeatable. Otherwise every creator decision turns into gut feel, internal debate, and inconsistent outcomes.
Start with one standard calculation method
If your team uses different formulas for different creators, your shortlist will be noisy from the beginning.
Choose the formula that fits the campaign. For account-level comparison, follower-based engagement can work. For post performance, reach-based engagement is better. For Reels-heavy campaigns, view-based analysis matters more.
Hootsuite’s calculator guidance notes that the push for Instagram Reels in 2020 boosted UK engagement by 22% for video, and that view-based formulas such as (likes + comments + shares) ÷ views × 100 are considered 15% to 25% more accurate for video content in this context (Hootsuite calculator page).
If the campaign brief is video-first and you still vet creators with a static-post mindset, you’ll misread who’s good at moving viewers to respond.
A practical review sequence
Use a shortlist process like this:
Calculate engagement the same way for everyone Don’t mix follower, reach, and views in one comparison sheet.
Check the creator against the right benchmark tier Compare small creators with small creators. Don’t penalise scale for behaving like scale.
Review recent content manually Look for audience quality, consistency, and whether the creator can integrate brands naturally.
Read comments like a buyer researcher You’re not counting noise. You’re looking for trust, curiosity, and relevance.
Check audience fit Location, niche, age band, and content style should match the outcome you want.
Don’t ignore workflow realities
Many teams lose time in this situation. They build a reasonable analysis framework, then manage it badly.
Manual sourcing across spreadsheets, screenshots, browser tabs, and DMs gets messy fast. Notes go missing. Formulas drift. Someone reviews one creator on comments and another on likes. The result is an inconsistent talent pool.
For teams trying to organise creator research more cleanly, lightweight workflow tools can help. Even adjacent tools such as the LunaBloom AI app are useful reminders that centralised review systems beat scattered manual processes every time.
The decision isn’t just who has the best rate
The right creator usually sits at the intersection of three things:
Strong enough engagement
Clear audience fit
Content style that can carry a commercial message without feeling forced
Field note: The best partnerships rarely come from the creator with the flashiest top-line metric. They come from the one whose audience behaviour matches the job you need done.
That job might be local footfall, online sales, review generation, repeat visits, or UGC for paid social. A calculator can help you narrow the field. It can’t tell you whether the creator can deliver the business outcome.
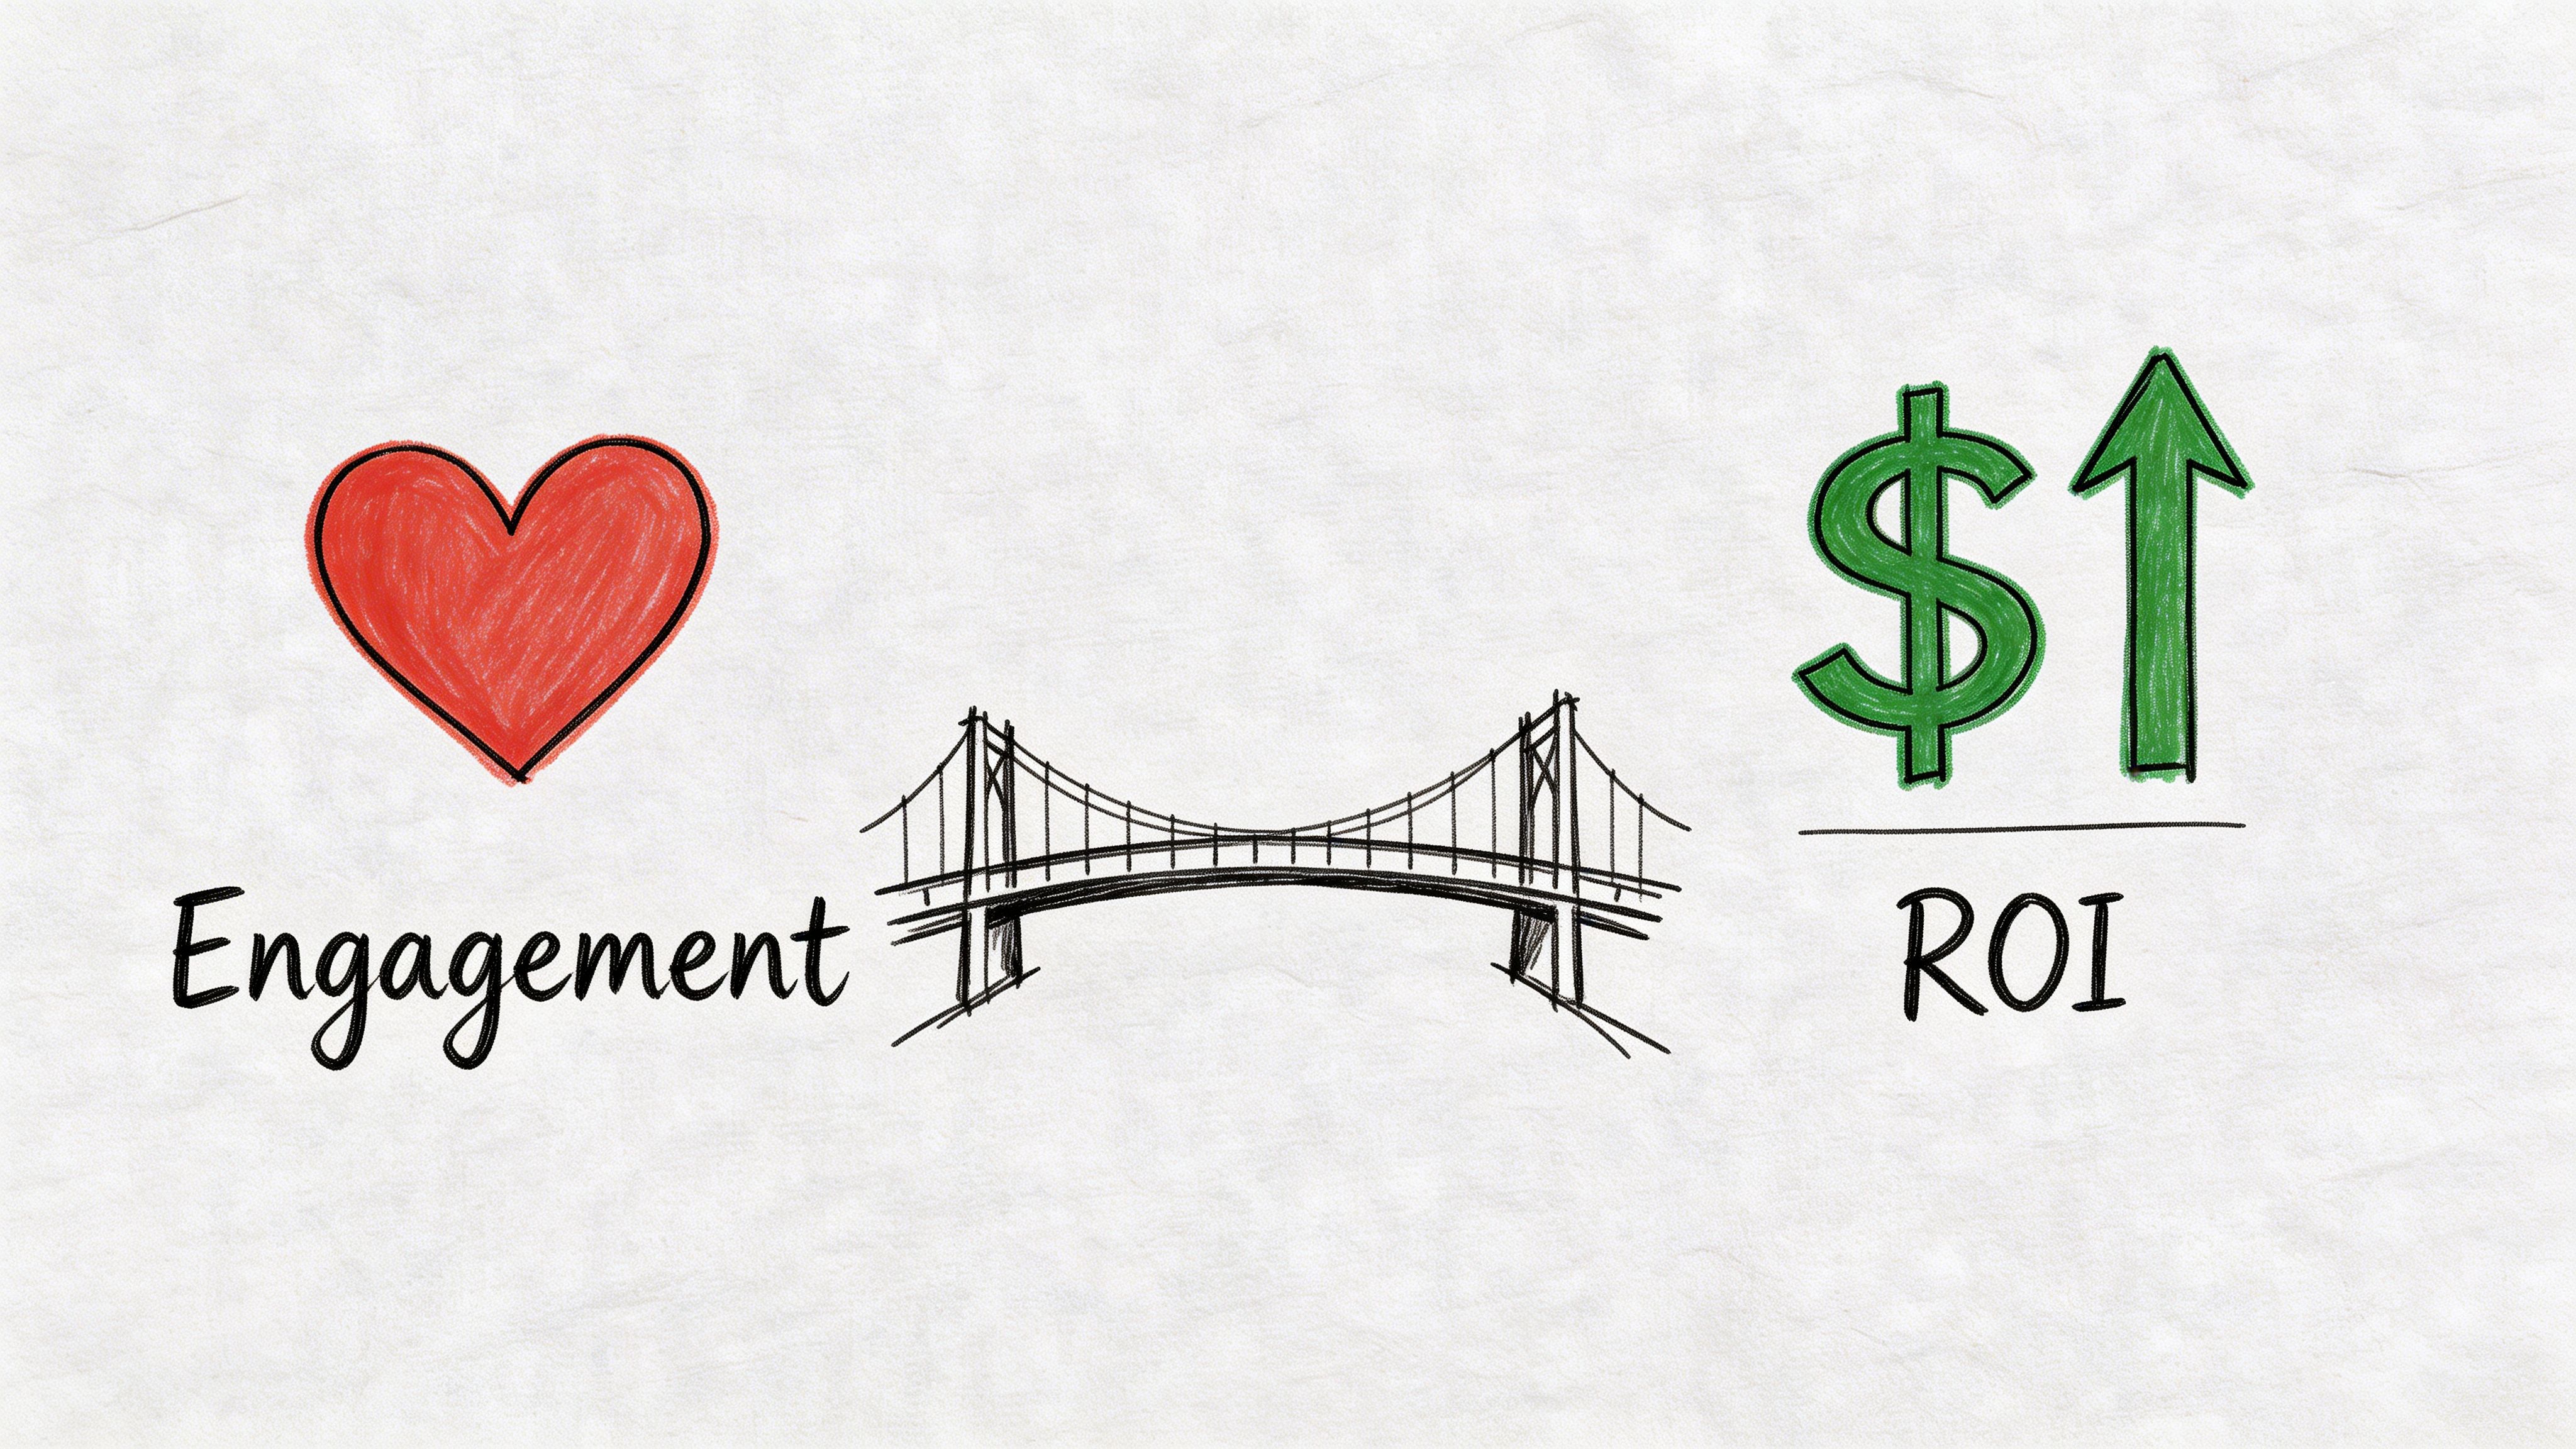
Moving Beyond Engagement to Measure True ROI
A creator can post a Reel that pulls strong likes, comments, and shares, then generate almost no sales. Another creator can look quieter on the surface and still drive profitable orders all week through a code and a tracked link. That is the point where an instagram engagement calculator stops being enough.
Why calculators stop short
Calculators help with screening. ROI measurement helps with budgeting.
A restaurant does not just need active comments. It needs bookings, walk-ins, and repeat visits it can trace back to a creator. A DTC brand needs to know which Story, Reel, or code produced purchases. An agency wants to report outcomes without hand-waving around “awareness.” Those are performance questions, and engagement alone cannot answer them.
That is why experienced teams treat engagement as an early signal, not a verdict. It helps narrow the shortlist. It does not tell finance what to keep funding.
What better measurement looks like
A stronger setup connects creator activity to actions with commercial value:
Unique promo code redemptions
UTM-tagged clicks
Bookings or purchases
Revenue by creator
Creative reuse value across paid and organic channels
Once those inputs are in place, influencer marketing becomes easier to evaluate against paid social, affiliates, and other acquisition channels. The question changes from “Who got the best engagement rate?” to “Who produced margin after fees, product cost, and media support?”
If you need a clean finance refresher first, this guide on how to calculate Return on Investment is a useful reference before layering creator attribution into the model.
Engagement is a leading indicator, not the final KPI
High engagement still has value. It often signals that a creator can hold attention long enough to influence a decision.
But business impact shows up later in the funnel. Clicks, redemptions, leads, purchases, and revenue answer the question that calculators cannot answer. Did this partnership create value after costs?
In practice, the strongest reporting stacks look at both layers together. Engagement explains audience response. Attribution explains commercial return. For a practical framework on that broader measurement model, Sup’s article on the metrics that matter in influencer marketing is worth reading.
The smarter long-term approach
Basic calculators still deserve a place in the workflow. They are fast, cheap, and useful for first-pass filtering.
But teams that run creator programs at any real volume usually outgrow spreadsheet attribution. They need one system for creators, content, links, codes, conversions, payments, and reporting. Sup takes that approach. Instead of stopping at top-line engagement, it helps teams connect posts to clicks, clicks to purchases, and purchases to revenue, which is what makes the channel easier to scale with confidence.
That is the practical shift. Use calculators to screen. Use attribution to decide where the budget goes.
Frequently Asked Questions on Engagement Calculation
Question | Answer |
|---|---|
What is an instagram engagement calculator? | It’s a tool that estimates how actively a creator’s audience interacts with content, usually using likes, comments, shares, saves, reach, followers, or views. |
Which formula should I use? | Use the formula that matches the campaign objective. Follower-based formulas are useful for community comparison. Reach-based formulas are better for post performance. View-based formulas suit video-first campaigns. |
Is a high engagement rate always good? | No. It can be inflated by viral outliers, weak comment quality, or manipulated activity. Check consistency and audience relevance before making a decision. |
What counts as a good engagement rate? | It depends on creator size. Broad benchmarks help, but the right comparison is always within the same follower tier and campaign context. |
Can I rely on engagement alone to choose creators? | No. Engagement is a screening metric. You still need audience fit, content quality, and business attribution. |
What should brands measure after engagement? | Track outcomes such as clicks, code redemptions, bookings, purchases, and revenue so you can connect creator activity to ROI. |
If you want to stop guessing which creators drive results, Sup gives you a done-with-you way to source micro and nano influencers, launch campaigns with promo codes and UTM links, and see attributed clicks, conversions, bookings, and revenue in one dashboard. It’s built for brands and agencies that want creator marketing to be measurable, not just busy.

Matt Greenwell
Share