
If you want to get serious about measuring influencer marketing, there’s one fundamental change you have to make. It’s time to shift your focus from vanity metrics—things like likes and impressions—to the business-focused metrics that actually affect your bottom line. Real success isn't about generating social buzz; it’s about tracking sales, acquiring new customers, and proving a clear return on investment (ROI).
Moving Beyond Likes to Business-Focused Metrics
Does this sound familiar? You're staring at a dashboard overflowing with likes and shares, but you still have a nagging feeling you don’t know what impact it’s all having on your sales. You’re not the only one. The conversation around influencer marketing has finally matured, moving past superficial engagement to focus on the hard numbers that genuinely drive business growth.
In the UK, the investment in influencer marketing is absolutely booming. It’s expected to hit £930 million in 2024 and is on track to reach a staggering £1.3 billion by 2029. This kind of money on the table explains why measuring ROI is no longer a "nice to have"—it's the only metric that really counts. With 81% of UK marketers planning to increase their influencer budgets for 2026, the pressure to connect views to clicks and, ultimately, to revenue has never been greater.
The Problem with Vanity Metrics
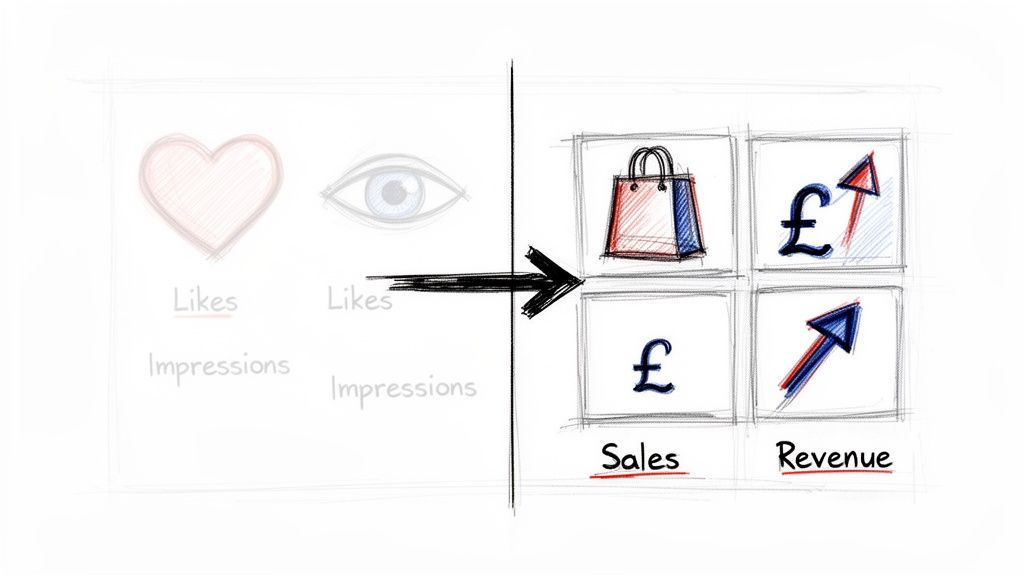
Vanity metrics—likes, follower counts, impressions—feel great, but they don’t pay the bills. They represent potential eyeballs, not actual business impact. A video can go viral and rack up a million views, but if it doesn't lead to a single sale or restaurant booking, it's failed from a commercial standpoint.
The real challenge for today’s marketers is drawing a straight line from social media activity to tangible business outcomes. This means we have to stop obsessing over hollow engagement and start focusing on what truly matters: sales, customer acquisition, and a measurable ROI.
The most successful e-commerce brands and restaurant chains I've worked with have learned to separate their campaign goals into two clear streams:
Awareness Goals: These are all about introducing the brand to fresh audiences. Here, you’ll track metrics like reach, impressions, and share of voice.
Performance Goals: This is where you drive specific, valuable actions. The key metrics become conversion rates, cost per acquisition (CPA), and promo code redemptions.
To help you get started, here's a quick look at how these metrics stack up against each other.
Vanity Metrics vs. Business Metrics
Metric Type | Examples | What It Tells You | Business Impact |
|---|---|---|---|
Vanity Metrics | Likes, Follower Count, Impressions, Video Views | Potential reach and surface-level engagement. | Low. Does not directly correlate to revenue or growth. |
Business Metrics | Conversion Rate, CPA, Promo Code Redemptions, ROI | How many people took a valuable action (e.g., made a purchase). | High. Directly tied to sales, customer acquisition, and profit. |
This table makes it pretty clear: while vanity metrics can offer a glimpse into brand visibility, they don't tell you anything about whether your influencer campaigns are actually making you money.
Shifting to Performance-Driven Measurement
Making this pivot towards performance is what turns an influencer programme from an unpredictable expense into a reliable growth engine for your business. The first step? Stop lumping all social media activity into one big bucket.
For example, many platforms will proudly report Gross Merchandise Value (GMV), but this figure is often misleading. It can include cancelled orders, fraudulent purchases, and customer returns, which paints a far rosier picture than reality. It's vital to start by understanding why GMV is a vanity metric so you can focus on indicators that reflect true performance.
Think of this guide as your playbook for measuring influencer marketing the right way. We'll walk you through how to set up proper tracking, calculate your true ROI, and build reports that clearly demonstrate the value of your creator partnerships. By the time you're done, you'll have a solid framework for turning influencer collaborations into a measurable and scalable part of your marketing strategy.
Matching Your Goals with the Right Influencer Metrics
Before you even think about which influencers to hire, you need to get crystal clear on what a “win” actually looks like for your campaign. It’s a common mistake to chase the wrong numbers. Not every campaign is about driving instant sales, and not all metrics carry the same weight.
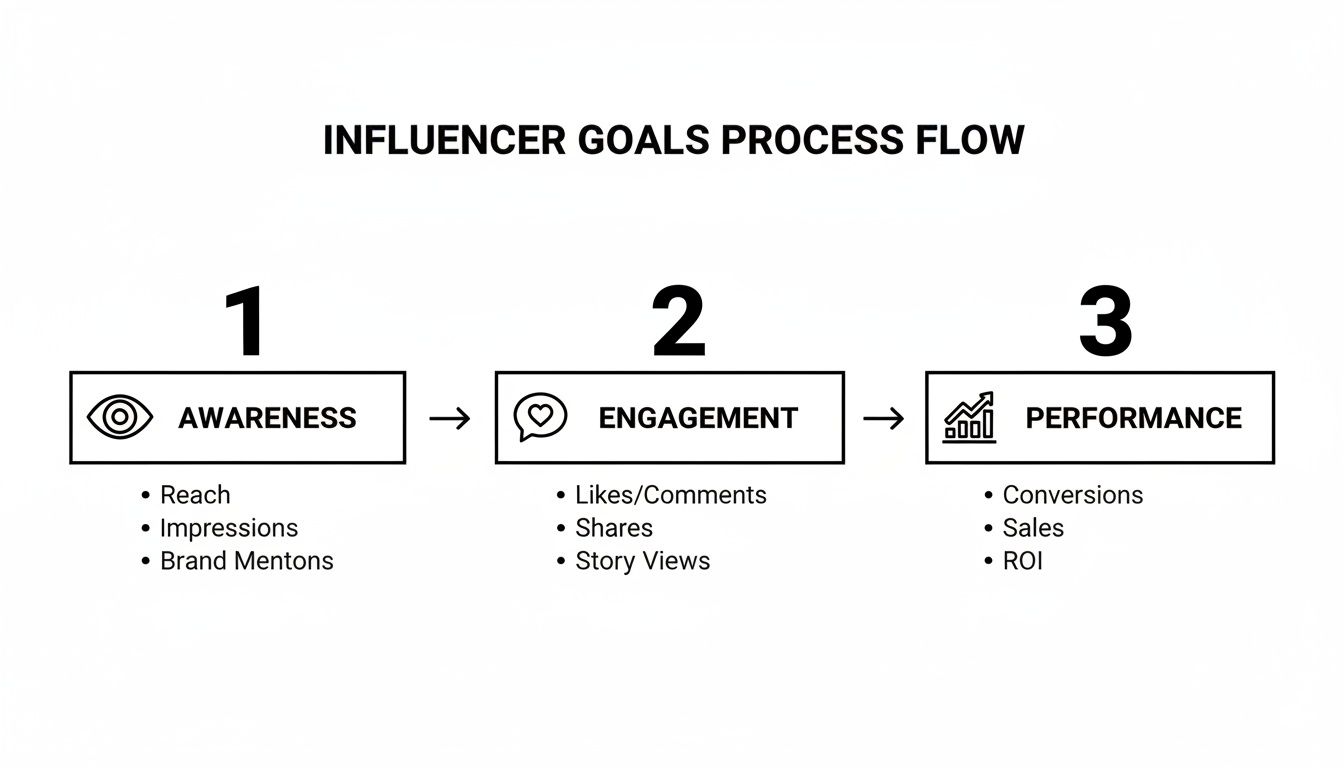
The whole game is about aligning your business goals with the right key performance indicators (KPIs) from the very beginning. This simple step prevents you from getting distracted by vanity metrics that look impressive but do nothing for your bottom line. Broadly speaking, your goals will fall into one of two camps: building brand awareness or driving direct performance.
The Awareness Pathway: Getting Your Name Out There
If your main objective is to put your brand on the map for a new audience or simply boost your visibility, then you’ll want to focus on awareness metrics. These are the numbers that tell you how many people are seeing your brand and how much space you’re taking up in your target market.
Think of it this way: you’re opening a new independent café in a bustling London neighbourhood. Before you can expect a queue snaking out the door, people first need to realise you exist. An awareness campaign is where you start.
For that kind of goal, you’d be watching metrics like:
Reach: The total number of unique people who saw the influencer’s content. This shows the sheer size of the audience you’ve touched.
Impressions: The total number of times the content was shown. This hints at the frequency and repetition of your message.
Share of Voice (SOV): How often your brand is mentioned compared to your direct competitors. A great way to see if you’re cutting through the noise.
These numbers won’t give you a direct sales figure, but they are crucial. They confirm that your brand is gaining traction and becoming part of the local conversation—laying the groundwork for future sales.
The Performance Pathway: Driving Real Action
Now, when your goal is to generate a direct, measurable result, your focus needs to shift entirely. This is where you track performance metrics—the KPIs that have a real, tangible impact on your revenue and customer numbers. Frankly, these are the figures that your finance team actually cares about.
Let’s imagine you’re a direct-to-consumer (DTC) brand launching a new skincare line. Your objective is brutally simple: sell the product.
In this performance-driven scenario, you’re tracking the hard numbers:
Conversion Rate: The percentage of people who clicked an influencer’s link and actually made a purchase. This is a pure measure of an influencer’s power to persuade.
Cost Per Acquisition (CPA): How much you spent to gain one new customer. Our guide on how to calculate customer acquisition cost is a great resource for digging into this critical metric.
Promo Code Redemptions: The number of times an influencer’s unique discount code was used. This gives you undeniable proof of where sales came from.
Return on Investment (ROI): The total revenue generated versus the campaign’s total cost. This is the ultimate test of profitability.
Focusing on these performance metrics is particularly effective when working with nano and micro-influencers. Their smaller, highly-engaged communities often deliver a superior return on investment for conversion-focused goals.
Recent data from the UK market really hammers this home. As brands have become more obsessed with ROI, micro-influencers (10k-100k followers) and nano-influencers (1k-10k followers) have taken centre stage. A staggering 93% of marketers now use micro-influencers, and 60% use nano-influencers. Why? Because 47% of UK consumers make purchases based on creator recommendations, and smaller creators tend to have a more authentic, trusted voice.
It's also vital to understand the platforms where these creators live and breathe. If you're trying to master the details of a specific social network, diving into resources like A Complete Guide to Facebook for Influencers can be incredibly helpful. By deciding upfront whether your goal is awareness or performance, you can pick the right metrics—and the right influencers—to get the job done properly.
Setting Up Your Measurement and Tracking System
Right, you’ve sorted your goals and picked your metrics. Now for the crucial part: building the engine that actually captures all this data. Without a solid tracking setup, you're essentially flying blind. This is where we stop talking theory and start getting our hands dirty, creating a system that ditches the guesswork and gives you clear attribution for every single campaign.
The goal here isn't just to hoard data. It's to build a smart, connected framework where every piece of influencer content is tied to a measurable result. Think less about clunky spreadsheets and more about an automated system that shows you exactly what’s working and where your budget is having the biggest impact.
This chart breaks down how you can track everything from top-of-funnel awareness right through to bottom-line performance.
The big takeaway? Different tools work best for different stages. A good measurement strategy uses a mix of them to see the full picture.
Start with UTMs: The Foundation of All Tracking
First things first: Urchin Tracking Modules, or UTMs. If you’re not using them, you need to start. These are simple bits of text added to the end of a URL that act like digital breadcrumbs, telling your analytics tools exactly which influencer and which post sent a visitor your way.
Creating unique UTM links for every influencer—and frankly, for every single post or story—is non-negotiable. It’s the only way to get true granularity. You’ll be able to see that an influencer’s Instagram Reel drove 3x more traffic than their Stories, which is the kind of insight that should immediately shape your next campaign with them.
Here’s what a proper UTM link looks like in practice:
yourwebsite.co.uk/product?utm_source=instagram&utm_medium=influencer&utm_campaign=spring2026&utm_content=sarahjones_reel
utm_source: The platform where the link lives (e.g., instagram, tiktok).utm_medium: The marketing channel (e.g., influencer, cpc).utm_campaign: The name of your specific campaign (e.g., spring2026).utm_content: A descriptor for the influencer and content (e.g., sarahjones_reel).
This simple structure feeds clean, organised data straight into Google Analytics, letting you slice and dice your traffic with surgical precision.
Use Unique Promo Codes to Track Sales
For any brand selling directly to consumers, unique discount codes are your best friend. They give you a straightforward way to tie sales directly back to a specific creator. They’re also a fantastic safety net for when UTM tracking breaks down, like when someone sees a post on their phone but buys later on their desktop.
But they do more than just track. A code like “SARAH15” gives the audience a real reason to act now. It adds tangible value to the influencer’s content and turns a passive follower into an active customer.
This approach is so effective that it warrants its own strategy. We’ve gone deeper on this before, and you can learn how to track influencer marketing attribution with promo codes to see how they slot into a broader plan. The good news is that most modern influencer platforms can generate and track these codes for you automatically.
Level Up with Pixels and Affiliate Links
Ready to get more advanced? This is where tracking pixels and affiliate links come in. A tracking pixel (like the Meta Pixel or TikTok Pixel) is a snippet of code you place on your website. It fires when users take specific actions, like adding an item to their basket or completing a checkout.
When you use pixels alongside your UTM data, you get a powerful, end-to-end view of the customer’s journey.
By layering UTMs, discount codes, and pixels, you create a powerful, multi-touch attribution system. It’s about building a web that catches data from every angle, giving you the confidence to scale your programme because you know exactly what’s driving results.
Affiliate links are the final piece of the performance puzzle. These are unique, trackable links that formally tie an influencer's pay to the sales they generate within a specific timeframe (the "cookie window"). It creates a true performance-based partnership where everyone's interests are aligned: the influencer earns a commission, and you only pay for tangible revenue. It’s the purest way to connect your marketing spend directly to your sales.
Calculating True Impact with Incremental Lift and ROI
So, your UTMs are tracking clicks and your promo codes are flying, but that only tells half the story. The real question we need to answer is this: did your influencer campaign drive sales that wouldn't have happened anyway? This is where we go beyond surface-level metrics and get into the serious business of proving undeniable impact.
We’re talking about measuring incremental lift. This is a game-changer for proving the true value of your creator partnerships. It’s all about isolating the effect of your influencer activity from all your other marketing channels, so you can confidently say, "This campaign generated X amount of new revenue."
Proving Additionality with Control Groups
The secret to measuring incremental lift is running a proper controlled experiment. You need a baseline to compare against, and the cleanest way to get one is by using a control group—a segment of your audience that is deliberately not exposed to the influencer campaign.
This simple setup lets you see the difference in behaviour between the people who saw the content (your test group) and those who didn't. Any uplift in sales from the test group can then be directly and confidently attributed to the influencer's impact.
There are a couple of clever ways I've seen brands run these tests:
Holdout Groups: This is where you identify a segment of your audience—say, from your customer list or social media following—and actively exclude them from seeing the campaign content. You could, for instance, exclude a percentage of your email subscribers from receiving the campaign announcement that features your influencer.
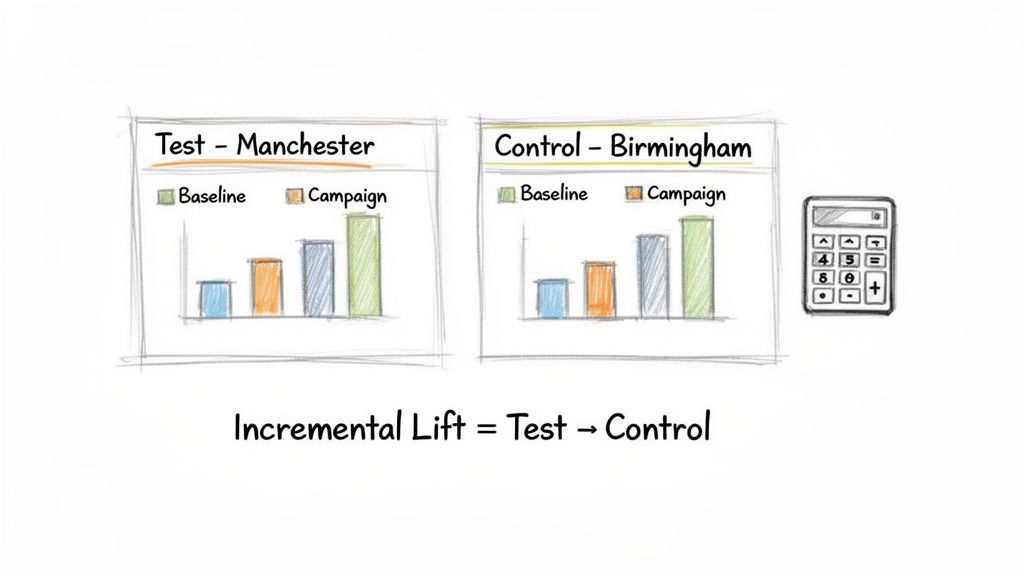
Geo-Split Tests: This is a brilliant tactic for brands with a physical presence, like restaurants or retail shops. You could run an influencer campaign targeting customers in Manchester while using Birmingham as your control city, then carefully monitor the sales data from both locations.
The whole point is to create a clean comparison. If sales in Manchester (your test city) jump by 15% but sales in Birmingham (your control city) only tick up by 3%, you can confidently attribute that 12% difference to your influencer campaign. That’s your incremental lift.
Calculating Your Influencer Marketing ROI
Once you have a firm grasp on the actual revenue your campaign has generated, the final piece of the puzzle is calculating its Return on Investment (ROI). This is the ultimate metric for showing that influencer marketing isn’t just an expense, but a profitable and predictable revenue driver for your business.
The formula itself is simple:
ROI = (Revenue from Campaign - Total Campaign Cost) / Total Campaign Cost
But the real key is being ruthlessly honest about what you include in 'Total Campaign Cost'. It's always more than just what you paid the influencer. A true cost breakdown includes everything:
Creator Fees: The direct payment to the creator.
Product Seeding Costs: The value of any free products or services you provided.
Agency or Platform Fees: Any software or agency support you used to run the campaign.
Content Production Costs: Extra expenses for photoshoots, video editing, or travel.
Internal Team Time: Don't forget this one! The cost of your team's hours spent managing everything.
Nailing this calculation is more crucial than ever. For UK brands, ROI attribution is now the number one metric. With global benchmarks showing an average return of £4.55 for every £1 spent, the pressure is on to prove your worth. And as 81% of UK brands increase their influencer budgets—with some spending over £1 million annually—platforms offering real-time tracking are absolutely essential for justifying that spend. If you’re digging into the numbers, our guide to influencer marketing statistics for 2026 is packed with more fascinating data.
This level of detailed measurement is what justifies bigger budgets and proves that creator partnerships, especially the long-term ones favoured by 61% of marketers, are a sustainable channel for growth. By combining incremental lift with a precise ROI calculation, you move from hoping your campaigns work to knowing exactly how much they contribute to the bottom line.
Creating Actionable Reports for Stakeholders
All that effort you put into tracking goes to waste if you can't tell a clear story with the numbers. The final, and arguably most important, part of measuring influencer marketing is turning your metrics into persuasive reports that actually make sense to everyone involved—from your marketing team right up to the C-suite.
A great report is more than just a data dump. It needs to weave a narrative, explaining not just what happened, but why it happened and what you should do next. This is how you move from simply collecting data to making genuinely data-backed decisions. It’s also how you get the green light for future campaigns and prove that your influencer programme is a powerful engine for growth.
Structuring Your Influencer Marketing Report
Let's be honest, stakeholders are busy. A well-structured report respects their time by starting broad and then allowing them to drill down into the specifics if they want to.
Every report you create should kick off with an Executive Summary. Think of this as the one-page snapshot that gives the entire campaign story in 60 seconds. It absolutely must include:
The Campaign Goal: A quick reminder of the objective (e.g., "drive online sales for the new spring collection").
Key Performance Highlights: Your top three or four wins. This could be total revenue, a fantastic return on investment, or a low cost per acquisition.
The Final ROI Figure: This is the bottom line. State it clearly and with confidence.
With a sharp summary like this, a time-poor executive can immediately grasp the campaign's value. The rest of the report then provides the detailed breakdown for those who need it, like your marketing and finance teams.
The most effective reports are built like a pyramid. They start with a sharp, concise executive summary at the top for leadership and then broaden into a solid base of detailed data that the marketing team can use for future planning and optimisation.
Essential Components of a Detailed Dashboard
Once you get past the summary, your report needs to present the deeper data in a way that’s comprehensive but not overwhelming. This is where a visual dashboard really shines, as it helps people spot trends and top performers at a glance.
A clean, well-organised dashboard pulls all the crucial information into one place, making performance assessment much faster. Look at this example from Sup; it neatly visualises everything from the top-performing creators to the exact number of promo code redemptions and total spend.
This kind of centralisation is exactly what you should be aiming for. It stops people from having to hunt for information across different spreadsheets and documents.
To help you build your own reporting framework, we’ve put together a template outlining the essential sections. Think of this as your blueprint for creating a report that covers all the bases.
Essential Influencer Marketing Report Template
Here’s a structured outline you can adapt for your own campaigns. It’s designed to communicate performance clearly and effectively to any stakeholder.
Report Section | Key Metrics to Include | Purpose |
|---|---|---|
Performance Overview | Total Spend, Revenue Generated, ROI, Incremental Lift, CPA, Promo Redemptions | Provides the top-line financial results and profitability of the campaign. |
Top-Performing Creators | Individual ROI, Conversions, Engagement Rate, Clicks per Creator | Identifies which influencer partnerships delivered the most value, guiding future selections. |
Standout Content | Links/Screenshots of top posts, Views, Likes, Comments, Shares per post | Showcases the creative that resonated most with the audience to inform future content briefs. |
Audience Insights | Demographics of engaged users, Follower Growth, Brand Mentions | Highlights the audience you reached and the impact on brand visibility and conversation. |
Learnings & Next Steps | Key takeaways from the data, strategic recommendations for the next campaign | Translates data into actionable insights to ensure continuous improvement. |
By creating a repeatable reporting process like this, you establish a powerful feedback loop. Each campaign doesn't just end; it provides the strategic insights you need to make the next one even better. This is how you elevate influencer marketing from a series of one-off activities into a predictable and consistent driver of business growth.
Your Influencer Measurement Questions, Answered
Over the years, we've seen the same questions pop up time and again when brands and agencies get serious about measuring their influencer campaigns. Here are our straightforward answers to some of the most common sticking points we encounter.
How Long Does It Take to See ROI from an Influencer Campaign?
This really is the million-dollar question, isn't it? The honest answer depends entirely on your goals.
If you’re running a direct-response campaign for an e-commerce brand, you can start seeing a return within just a few days of an influencer’s content going live. But for goals like building long-term brand awareness or driving footfall to a new restaurant, the impact is more of a slow burn, building over several weeks or even months.
Our advice: Don't pull the plug too early. We always recommend tracking performance for at least 30-90 days to capture the full, cumulative effect of a campaign.
What Is a Good Benchmark for Engagement Rate?
There's no single magic number, as engagement rates are heavily influenced by an influencer's audience size.
Generally, you'll find that micro-influencers (those with 10k-100k followers) have more tight-knit communities and can often achieve a healthy 3-6% engagement rate. Once you move up to macro-influencers (100k+ followers), that rate typically settles around 1-3%. If you’re seeing numbers significantly below these benchmarks, it might be a red flag that the influencer’s audience isn’t as connected as you'd hope.
How Do You Track Performance Without Discount Codes?
Promo codes are great, but they're far from the only way to attribute success. In fact, relying on them alone can mean you're missing a huge piece of the puzzle.
First and foremost, UTM links are your best friend. They allow you to track exactly who is clicking through to your website directly within tools like Google Analytics. Beyond that, setting up a tracking pixel (like the Meta Pixel or TikTok Pixel) is non-negotiable. This lets you attribute valuable actions like ‘add to basket’ or a completed purchase directly back to the traffic an influencer sent, giving you crystal-clear data without needing a discount code at all.
Ready to stop guessing and start measuring? Sup turns influencer marketing into a predictable growth channel with real-time attribution for every campaign. See how much time and money you can save by visiting https://www.sup.co.

Matt Greenwell
Share